We arrived at our first station at around 7 o’clock in the morning on the 8th, and the approximate location can be seen in the first image as the white triangle at about 60°N and 180°E, near the Russian/U.S. economic exclusion zone (EEZ) boundary (in U.S. waters). On our transit to station 1, we had two rinse (or practice) stations, which are necessary for rinsing and testing the closing mechanisms of the Niskin bottles, and ensuring that our sampling procedures are efficient and our instruments are working properly.
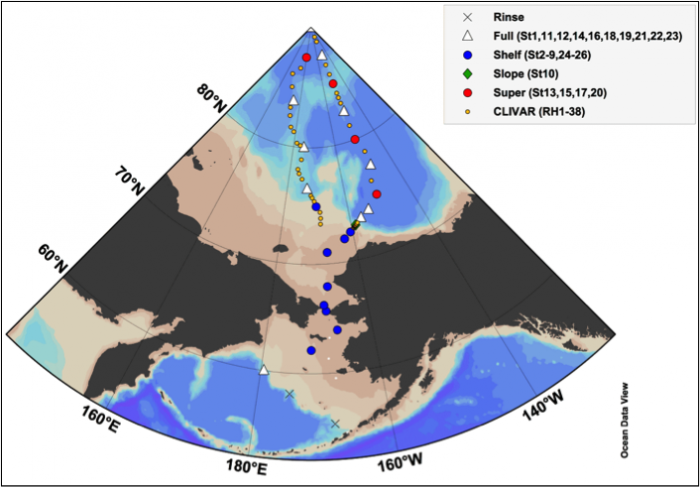 |
| Station map planned for the 2015 U.S. GEOTRACES Arctic Expedition (Kadko, 2015). |
At most stations during this cruise, we will be deploying rosettes equipped with either 12, 24 or 36 Niskin bottles to sample multiple depths throughout the water column (from bottom to top), illustrated by this animation and introduced in About the Cruise. Typically there are multiple casts at individual stations, either because there aren’t enough bottles in the rosette to resolve the full water column, or because multiple rosettes are necessary for our sampling requirements.
For the first cast of station 1, we deployed a special 24-bottle rosette, designed to prevent contamination from the ship (made of iron), so low concentrations of elements (i.e., trace elements) such as iron can be accurately sampled. Once we recovered the rosette, it was sampled by the GEOTRACES teams, who will later determine the concentrations of various trace elements in special laboratories at their home institutes.
Shortly after the recovery of the GEOTRACES rosette, a large-volume rosette, equipped with twelve 30 L bottles, was deployed using the A-frame on the starboard (right) side of the ship, which was deployed to a maximum depth of 740 m (or about 2440 feet). Casts usually take about 1 hour for every 1000 m, so after about 45 minutes the rosette was on deck and sampling began. Ryan and Fen sampled all Niskin bottles, which we have since analyzed for pH and total alkalinity (TA), and dissolved inorganic carbon (DIC) in the carbon van. While they sampled for those three parameters, I waited my turn to sample for dissolved organic carbon (DOC), which I have since preserved by placing samples in the freezer. Once the cruise is over and the Healy has returned to Seattle in November, coolers filled with frozen DOC samples will be shipped to Miami, where they will be analyzed at University of Miami’s Rosenstiel School of Marine and Atmospheric Science, where I am currently pursuing my PhD.
 |
| The large-volume rosette being deployed at station 1. Notice how the bottle caps (top and bottom) are held open by the spring-loaded lanyards. Once the maximum depth was reached, bottles were triggered to close at the desired depths, collecting our seawater samples. The instrument package under the bottles is the CTD sensor package. |
I had hoped to write this post on the carbon van and some of our instruments, however, I thought it would be best to write about our first station. Ryan, Fen and I are just starting to get settled in the van, and now that the first station is behind us, we are getting a sense for the rhythm of our sampling and analysis procedures. Once we get that rhythm down, I will write a post about the work we are doing in the carbon van and the CO2 system in seawater.
 |
| How does our lab van look compared to in June when we were in Seattle? The instrument on the left analyzes samples for pH, while the instrument on the right analyzes for TA (second TA instrument in partial view on the left). |
This is my last post for the week, so expect a new post either Monday or Tuesday next week. As I write this, all sampling at station 1 is complete and we are now steaming to station 2 to begin our shelf sampling stations.
—AA
—AA